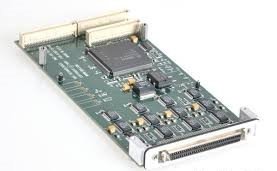


The Intel/Wind River/EST VisionPROBE is an on-chip software debugger for Motorola PowerPC, 68K, and ColdFire microprocessors. It provides direct access to the processor core, enabling real-time analysis and control of software execution in embedded systems. The debugger streamlines development, testing, and debugging cycles through industry-standard debugging operations.
Technical Specifications
• Target Processors: Motorola PowerPC, 68K, and ColdFire microprocessors
• On-Chip Debugging: Direct processor core access for real-time analysis and execution control
• Breakpoint Management: Set and manage breakpoints to halt execution at specified points
• Memory Inspection: Examine and analyze system memory contents
• Single-Stepping: Execute code one instruction at a time for detailed analysis
• Host Interface: Connection to host development system via dedicated debugger interface
• Processor Connection: Direct on-chip interface to target processor core
– Key Features
The VisionPROBE delivers low-level debugging capabilities essential to embedded system development. Its on-chip architecture eliminates the need for external emulation logic, reducing latency and enabling introspection of real-time execution. Breakpoint functionality supports deterministic program control, while memory inspection tools permit exhaustive analysis of RAM, registers, and peripheral state. Single-stepping capability enables instruction-by-instruction verification of algorithm behavior.
– Typical Applications
Embedded software development on PowerPC, 68K, and ColdFire platforms benefits from the VisionPROBE’s direct processor coupling. Device drivers, real-time firmware, and system-level code validation leverage on-chip debugging to verify execution flow and state transitions without external probes or performance degradation.
– Compatibility & Integration
The debugger integrates with development environments supporting Motorola PowerPC, 68K, and ColdFire architectures that implement on-chip debugging methodologies. Host systems connect via the dedicated debugger interface, enabling transparent integration into established embedded development workflows.